
STREMS ANALYSIS*
Prof. Jerry I. Porras of the Stanford Graduate School of Business has invented a new technique for managing the process of change in an organization from diagnosis to follow-up. He calls it Stream Analysis.
The Stream Analysis approach is rooted in systems theory and social cognitive theory.
It is based on systems theory in that "it assumes that organizations are open systems; the they consist of various subsystems, each of which can be characterized as consisting of streams of similar variables; that many of these variables are connected, either causally or merely relationally, to other variables both within their same stream or across streams; and that instituting actions which change one variable will be resisted by other connected variables which are not targets of intervention. At the same time, these other connected variables will be affected by changes in the original variable."
The Stream Analysis is also based on social cognitive theory which "emphasizes the effect of environment on behaviour of people in it. People are influenced by the messages they receive from the setting they are in. Messages that affect their expectations about what they will get out of behaving in the manner signaled by their environment. Stream Analysis operationalizes these ideas by mapping out the complex set of organizational factors in which people work."
Now, does Stream Analysis have anything to do with organization development (OD)? Or how is it applied in an OD setting?
As a new technique for diagnosing, planning, and tracking organizational change, Stream Analysis has many advantages in OD efforts in that:
it is graphics-based: people do understand better when they see visual representations of complex phenomena; it can be used in several key stages of OD interventions: in finding out what is going wrong, in planning what to do about it, and in keeping track of what done;
it is not bound to one type of organizational setting or to any one theoretical perspective. This is a very important gap in current OD technology filled by the Stream approach.
Finally, Stream Analysis could be done by a manager alone or by a consultant wanting to have a clearer idea of each stage of change. It could be done by a small Change Management Team (CMT), responsible for guiding the interventions effort, or a larger number of organizational members could participate more extensively in various steps of analysis.
Application of Stream Analysis Technique.
When applying stream Analysis to the process of change, a CMT should be formed. A group of consultants may be considered a CMT. Or a CMT can be formed from a large number or small number of organizational members who are involved in the diagnostic process and who are not afraid to speak their minds. What is important is that the CMT members are able to weave the problems together into stories of the organization.
After a CMT is formed, the following are steps to be taken when applying the technique:
1. Problem Identification
The first step in applying the Stream Analysis approach is to generate a list of problems and enter them into a Stream Issues list. Collecting information on issues in the organization can be done in many ways viz. questionnaire, brainstorming, records search, etc.
2. Categorizing Problems (in boxes)
Each problem statement is then categorized into one of the organization dimensions: Organizing Arrangements, Social Factors, Technology, Physical Setting.
These dimensions make up the Stream Diagnostic Chart.
3. Identifying Interconnections
The next step is to identify the interconnections that exist among the problems charted. Discussions concerning "What causes what" helps the team develop shared assumptions about how the world works. The interconnecting problems are thus identified and joined together by drawing arrows.
4. Analyzing the Stream Diagnostic Chart
Prof. Porras has classified organizational problems into three types. According to him, symptomatic problems are highly visible in the organization and are driven by a relatively large number of other problems. A second type of problem is a core problem; a tremendous amount of leverage can be gained by resolving such problems. A third type of problem is sitting in the chart all by itself but which cannot be easily identified as they are systems problems. When they can be identified they can have a synergistic effect thus providing maximum advantage. A cluster of problems may be given a theme for easy identification.
The Stream software can identify these various types of problems and automatically repositions them so that core problems are at the top of the chart and symptomatic problems are at the bottom.
5. Formulating a Plan of Action
Once the diagnosis has been completed, the next step in the Stream Analysis approach is to create an action plan consistent with the identified problems. Stream Planning Charts can keep clear the rationale behind the various interventions being taken.
Stream Analysis Software (see example below)
After having identified and categorized issues by entering them into the appropriate stream column in boxes, and after having identified key interconnections between the issues by drawing arrows, Stream Analysis Software should be applied in order to simplify the complexity of the Diagnostic Chart (which is often the case). The SORT function of the Stream software will automatically rearrange the Diagnostic Chart: core problems will appear toward the top of the Chart, and the symptomatic problems will appear toward the bottom of the chart. Arrow connections between source boxes and destination boxes will remain connected during the SORT procedure.
Stream Diagnostic Chart
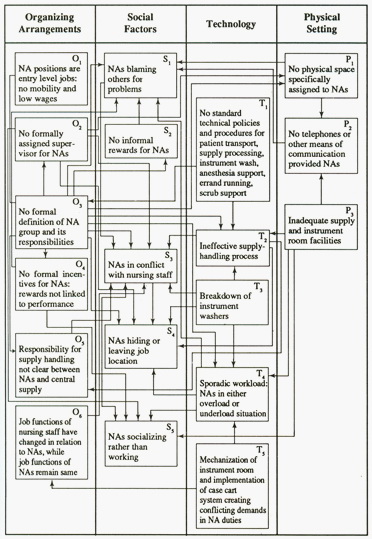
The following Stream Diagnostic Chart is given as an example of how each problem statement is categorized in boxed. This story refers to a group of nonprofessional employees called nursing assistant (NAs) in a large community hospital. In the example, the SORT function of the Stream software has automatically rearranged the Diagnostic Chart.
If the Stream Analysis Software is not available, boxes in the stream categories can also be rearranged by hand. However, with Stream Analysis Software you can have an easy tool to implement the Stream Analysis approach.
Reference: Stream Analysis, A Powerful Way to Diagnose and Manage Organizational Change by Jerry I.
Porras; Addison-Wesley Publishing Company Inc.
*Presented at the Southeast Asian Interdisciplinary Development Institution, Philippines
*ครู อาจารย์ นักบริหารการศึกษา และนักบริหารการพัฒนา : ภราดา ดร. ประทีป ม.โกมลมาศ